‘Four Nations’ Common Adversarial Analysis Assessment Methodology

The Four Nations group was founded in 1978 and consists of five central bank members – the Board of Governors of the Federal Reserve System, Bank of Canada, Reserve Bank of Australia, Bank of England and Banco de México. The group is a forum in which its members share information and experiences on banknote development, issuance and distribution, counterfeit deterrence, and relevant technical studies.
The group also provides an avenue for the members to collaborate on projects of common interest and confidentially share information in a meaningful way, such as the continuous sharing of adversarial analysis conducted by each central bank. This information exchange has proven to be enlightening and invaluable for all the central banks.
However, the group had no means to directly compare the adversarial analysis work performed by each central bank since each member assessed security features through their own unique methods and criteria. In 2015, a Four Nations working group began a collaborative project to create a common language and assessment system to enable the direct comparison of public overt adversarial analysis samples and results generated by each Four Nations member.
The project started with a workshop in which colleagues from each central bank jointly conducted adversarial analysis of two different security features. Once the samples were developed, the participants independently evaluated them using their own and the other central banks’ methodologies. The comparative results were then discussed to find advantages and opportunities for improvement for each assessment method.
During this process it became clear that each methodology assessed the quality of the sample and the complexity involved in the development of its method and production. This formed the starting point for the development of a common methodology that would prove to be immensely useful for all the Four Nations members.
As the process evolved, the quality levels were homologated to incorporate different assessment perspectives (such as the level of training acquired by different users) and the complexity levels were diversified to accurately capture the different elements of adversarial analysis methods.
The outcome was a methodology that consisted of a Quality Matrix and a Complexity Matrix. These matrices were reviewed and tested through several iterations before being formalized into the Common Adversarial Analysis Assessment Methodology (CAAAM), serving as the standard reference methodology for the group.
There have been many realized benefits of the CAAAM for the group, including:
Facilitation of the exchange of information on the resilience of a diverse range of security features with greater consistency and clarity between the members in different settings, such as technical meetings and collaborative projects; and
Strengthening the understanding of the adversarial analysis evaluation process between the members and enabling a more meaningful base of knowledge on security features of common interest.
While the CAAAM was initially conceptualized as a communication tool for use between the Four Nations central banks, the group acknowledges the benefit in sharing the methodology with the broader banknote industry to:
Promote a common language and adversarial analysis assessment criteria;
Strengthen the understanding of adversarial analysis conducted throughout the banknote supply chain; and
Build upon the combined experience of all the industry’s stakeholders to enhance the ever-growing base of knowledge and drive innovation.
Consequently, the methodology is presented below.
Methodology to Facilitate Common Understanding
Overview
The CAAAM can be used to evaluate both the quality and complexity of methods used to create adversarial analysis samples of public overt security features, as well as completed whole notes with public overt security features.
The CAAAM allows the assessor to independently evaluate the quality and complexity of adversarial analysis samples based on criteria established in two matrices (Quality Matrix and Complexity Matrix). Prior to the application of the methodology, it is important to acknowledge that:
This methodology is only applicable to overt public features;
Those using the methodology should be familiar with the original feature that the adversarial analysis sample is being evaluated against; and
The assessment results are only applicable to the specific feature evaluated, in the specified design, and for the method being assessed (results may vary by feature, design, and/or adversarial analysis methods).
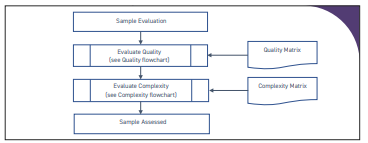
Once the adversarial analysis sample is produced, the assessor will evaluate the sample through the quality assessment process, followed by evaluating the complexity of the method used to produce the sample as outlined in the flowchart in Figure 1.
Quality assessment
When evaluating the quality level of the sample, the assessor must first determine how different the appearance of the sample is from the original feature. The assessor then determines the level of inspection that three different types of banknote users would require to distinguish the adversarial analysis sample from the original sample as shown in the flowchart in Figure 2.
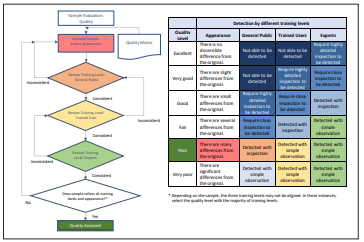
The types of users are defined by their level of training on banknote authentication: general public, trained user, and expert (refer to the Definitions table for more detail). Based on the results, a quality level will be determined for the sample (one of 6 levels ranging from Very Poor to Excellent, as shown in the Quality Matrix in Figure 2).
Application – the methodology is best understood by applying the methodology to a scenario. For further clarity on the terms used, refer to the Definitions table. The methodology will be demonstrated by considering an adversarial analysis simulation (Simulation A) of a fictious feature.
As per the flowchart shown in Figure 2, the first step is to assess the appearance. The appearance of Simulation A was assessed and determined to contain many differences from the original feature. The result is highlighted in red on the Quality Matrix in Figure 2.
The second step is to review ‘Training Level – General Public’. It was determined by the assessor that to distinguish Simulation A from the original feature, the general public would require a brief pause in user activity. Thus, it was determined that Simulation A could be detected with inspection by the general public. The result is highlighted in orange on the Quality Matrix in Figure 2.
The next step is to review ‘Training Level – Trained Users’. It was determined by the assessor that trained users would be able to distinguish Simulation A from the original feature during their regular activities (eg. counting). Thus, it was determined that Simulation A could be detected with simple inspection by trained users. The result is highlighted in yellow on the Quality Matrix in Figure 2.
The fourth step is to review ‘Training Level – Experts’. It was determined by the assessor that experts would also be able to distinguish Simulation A from the original feature during their regular activities. Thus, it was determined that Simulation A could be detected with simple inspection by experts. The result is highlighted in light green on the Quality Matrix in Figure 2.
The final step is to select the quality level that best fits the results from the first four steps. In this example, it is clear that the results from the assessment correlates to a quality level of ‘Poor’ without any inconsistencies.
In the event that the results are inconsistent, the first approach is to review the step that resulted in the inconsistency. If the inconsistency still persists, then the quality level is determined based on the majority of results.
Complexity assessment
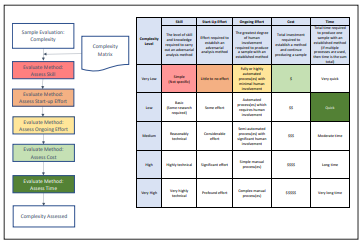
To assess the complexity level of the sample, the assessor must determine the overall difficulty to produce the adversarial analysis sample (refer to the flowchart in Figure 3) by evaluating five different aspects related to its production: Skill, Start-up Effort, Ongoing Effort, Cost and Time (refer to the Definitions table for more detail).
Each complexity aspect must be assigned one of five levels, ranging from Very Low to Very High (as shown in the Complexity Matrix in Figure 3). Understanding the method used to create the sample is a key factor for this process.
Application – after evaluating quality, the second part of the evaluation is complexity. The evaluation of Simulation A will be continued in this section to demonstrate the complexity assessment process.
As per Figure 3, the first step in assessing complexity is to evaluate Skill. There was no special skill or knowledge required to carry out the adversarial analysis method. Thus, Skill was determined to be Very Low. The result is highlighted in red on the Complexity Matrix in Figure 3.
The second step is to assess the Start-up Effort. The assessor determined that barely any effort was required to establish the adversarial analysis method. Thus, Start-up Effort was determined to be Very Low. The result is highlighted in orange on the Complexity Matrix in Figure 3.
Next the assessor evaluates the Ongoing Effort. The adversarial analysis method used to produce the samples was a highly automated process with minimal human involvement. As such, Ongoing Effort was determined to be Very Low. The result is highlighted in yellow on the Complexity Matrix in Figure 3.
The fourth step is to assess the Cost of the adversarial analysis method. The assessor determined that the total investment required to establish the method and continue producing samples was minimal. Thus, Cost was determined to be Very Low. The result is highlighted in light green on the Complexity Matrix in Figure 3.
Finally, the fifth step is to assess the total Time required to produce one sample once the method was established. The time taken was determined to be reasonably quick, but not inconsequential. As such, the Time was assessed as Low. The result is highlighted in dark green on the Complexity Matrix in Figure 3.
During the complexity assessment process, it is easy to see that determining some aspects may be quite challenging. If the method uses a number of different steps and/or processes, it may be difficult to determine the complexity. In these instances, consideration should be given to the method as a whole and if necessary, the level for each aspect selected should represent the greater threat.
The complexity of the method used to create the Simulation A sample has now been determined.
The quality and complexity assessment results can be presented in a table along with the key sample information, as illustrated in Figure 4.
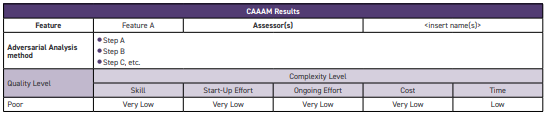
As with quality, it is understandable that achieving an overall complexity may be desirable. However, by individually listing the outcomes for the complexity aspects, those reading the results gain a greater understanding of the feature’s resilience.
Interpretation of the ratings obtained
The results of the matrices can be used to assess the resilience of public overt features specific to the method used to produce the adversarial analysis sample.
However, it should be noted that the results of an assessment are specific to the adversarial analysis sample and method being evaluated, and does not provide a universal assessment of the overall resilience of a public overt feature or whole note with a public overt feature(s).
To clarify, the relationship between the resilience of a feature/whole note with feature(s) and the results from the Quality Matrix and Complexity Matrix can be interpreted as outlined below:
The lower the assessed quality, the higher the likelihood an adversarial analysis sample would be distinguished from the original sample and therefore, the higher the resilience of a public overt feature to the specific method used to produce the adversarial analysis sample.
The higher complexity of a method, the lower the probability the method would be used to produce an adversarial analysis sample, and therefore, the higher the resilience of a public overt feature to the specific method used to produce the adversarial analysis sample.
Concluding remarks
The CAAAM is the result of a successful collaborative project that has greatly benefited the Four Nations members. This methodology has been developed through the combined knowledge and experience of the Four Nations central banks and has established an invaluable base of information on adversarial analysis for the group.
In general, common language has the potential of enhancing communication between the stakeholders in the banknote industry and positively impacting the industry. The Four Nations is disseminating the CAAAM to the banknote supply chain as a tool for communication on adversarial analysis assessments with the belief that a common language will contribute to innovation focused on reinforcing the security of products that are put into the hands of the public every day by:
Facilitating meaningful and constructive discussions on security feature assessment practices; and
Strengthening the understanding of adversarial analysis conducted throughout the banknote supply chain.
Furthermore, the methodology is an instrument that may supplement the adversarial capabilities at other central banks.
Finally, the Four Nations members hope that by sharing this work, it may inspire similar collaborative projects, or at the very least prompt active discussions between central banks and between central banks and suppliers; driving continuous innovation throughout the industry.
For all enquiries about the CAAAM, its use, application, interpretation and the contents of this article please contact 4N-CAAAM@rba.gov.au.
Terms and conditions of use
This methodology should not:
Be used as a marketing tool or referenced in marketing products by suppliers or vendors.
Be modified or altered in any way from its original format or process.
Definitions of Terms Used in CAAAM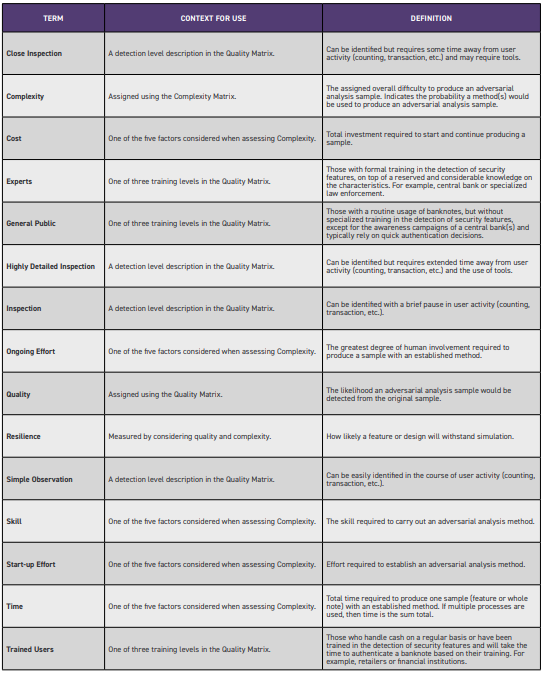
Subscriber content
Read the full article
Full access to Currency News articles, newsletters and archives.